
All in One View
Content from Python Basics Recap
Last updated on 2026-10-30 | Edit this page
Overview
Questions
- Python Refresher
Objectives
- Understanding key concepts in Python
This course follows on from the python introduction course. To ensure that we are starting from similar positions, there follows a short multiple choice quiz on key python concepts that we will be building on through this course.
Variables and Lists
1. Assigning a value to a variable
We wish to store the string Cat as a value in the
variable animal, which of these lines of code will do this
for us?
animal = 'Cat'animal = CatCat = animalanimal(Cat)
Answer 1 is correct
2. Assigning values to a list
We wish to create a list of values, which of these lines of code is valid to do this?
varlist = [34, 57, '2d']varlist = (12, 'vr', 95)varlist = 'xcf', 12, 97
Answer 1 is correct
3a. Indexing characters in a string
Lists and strings both contain multiple indexed values (in the case
of strings these are specifically individual characters rather than
other values). If we have a variable animal which contains
the string penguin, which of these options will print the
first character (p) for us?
print(animal[0])print(animal[1])print(animal['p'])
Answer 1 is correct
3b. Indexing characters in a string (slicing)
We can also select whole sections of lists and strings, not just
single elements. Using the same variable animal, containing
the string penguin, as above, which of these options will
print the last 2 characters for us? (Note that there is more an one
correct answer)
print(animal[5:])print(animal[6:])print(animal[6:7])print(animal[5:7])print(animal[-2:])print(animal[:-2])
Answers 1, 4, and 5 are correct
Loops
4. Constructing a for loop
Please write a simple for loop which will print out each
of the characters in the animal variable one at a time.
Software Modules
5. Loading new functions
We want to use the functions in the numpy library in our
code. How do we open this library in our code?
import numpyload numpyopen numpy
Answer 1 is correct
If statements and conditionals
6. Conditionals
Which of these conditional tests returns a True
result?
4 > 3'a' != 'b'6 >= 6.0'3' == 33 > 'c'
Answers 1, 2, and 3 return True results. 4 returns
False. 5 raises an Error.
B. Both 4 <= 5 and 4 < 5
would return a True result, but the if
statement is exited as soon as the True result is
returned.
Formatting Variables and Objects in Strings
Throughout this course, we will be printing the values of variables
inside strings to demonstrate what the code does. There are a number of
ways to this in Python; in this course we will be using
f-strings which are the recommended string interpolation
syntax from version 3.6 onwards.
To use f-strings simply start a string literal with
f or F, then embed whatever you want
interpolating into the string within curly braces {}:
OUTPUT
2 + 2 = 4Numerical values can be formatted using : inside the
curly braces. For example, an integer i can be made to have
a width n using {i:nd}, or
{i:0nd} to pad it out with zeros:
OUTPUT
One with four leading spaces     1
One with four leading zeros 00001
Floating point variables can have their precision specified with a
number after a decimal point and an f:
OUTPUT
3.141592653589793
pi to three decimal places is 3.142
Or made to use scientific notation with an e:
OUTPUT
1000000000.0
A billion in scientific notation is 1.0e+09
This is only scratching the surface of what you can do with
f-strings, they are often the most powerful and concise way
to format variables inside strings. However, there are occasions when
other methods are preferable, and you should be careful using them with
Python before
version 3.12.
To learn more, see: Python f-strings.
Generative AI
We would like to reiterate the Carpentries stance on Generative AI in coding which you may have seen when preparing for this course.
To summarise the position, the recommendation is that you avoid getting help from generative AI during the workshop for several reasons:
- For most problems you will encounter at this stage, help and answers can be found among the first results returned by searching the internet or looking on e.g. StackOverflow.
- The foundational knowledge and skills you will learn in this lesson by writing and fixing your own programs are essential to be able to evaluate the correctness and safety of any code you receive from online help or a generative AI chatbot. If you choose to use these tools in the future, the expertise you gain from learning and practising these fundamentals on your own will help you use them more effectively.
- As you continue programming, the mistakes you make will be the kinds that have also been made – and overcome! – by everybody else who learned to program before you. Since these mistakes and the questions you are likely to have at this stage are common, they are also better represented than other, more specialised problems and tasks in the data that was used to train generative AI tools. This means that a generative AI chatbot is more likely to produce accurate responses to questions that novices ask, which could give you a false impression of how reliable they will be when you are ready to do things that are more advanced.
- Assign values to variables using
= - Generate lists using square brackets
[] - Use indexes inside
[], starting at 0, to select characters from strings and items from lists - Use
forto loop through items in iterable objects - Make conditional expressions using
==,!=,>,<,>=and<= - Use
f'{}'to embed formatted variables inside strings - Avoid use of generative AI for this course
Content from Numpy and Matplotlib Essential
Last updated on 2026-10-30 | Edit this page
Overview
Questions
- How do I select data within tables for processing?
- How can I load different data formats?
Objectives
- Learn about NumPy matrix objects
- Learn about masking datasets
- Learn about specialised data formats, and how to use them
NumPy extends the Python language by providing new types (array, matrix, masked_array…), functions and methods to realise efficient numerical calculation using Python. NumPy is the numerical library for Python. It is too big to be covered in one day, so today we will learn a few of the basic objects and functions.
NumPy is a foundation block for many other python libraries used in science and data science, e.g.:
- scipy Fundamental library for scientific computing (interation, optimisation…)
- pandas data structure and data analysis tools
- matplotlib Python 2D plotting
And more specialised libraries such as:
- astropy for astronomy
- h5py to interact with HDF5 format datafiles
- scikit-learn for Machine Learning
- TensorFlow for Deep Learning
We are going to learn some of the basic commands not seen in the first course. We will introduce some of these libraries but keep in mind that we are just covering the basics so you can understand how to start using this library. If you find that your interest is piqued and/or they are applicable to your problem, you can use the documentation to learn more.
The array is the central object of NumPy. It is a multi-dimensional object which contains numerical data. The main difference between NumPy arrays and Python lists is the set of operations that can be performed on them. In this lesson we are going to learn a little more about how to use this fundamental library to do any numerical analysis in Python.
NumPy arrays are good for arrays of numerical data where each dimension is of a consistent size. Where you want to work with heterogeneous data and performance is not a problem, working with Python lists and dictionaries is easier than working with uneven datasets in NumPy. Similarly, while NumPy arrays do technically support having different data types in different columns, it is awkward to do and breaks a lot of the useful NumPy methods. It is best to use libraries for the specific purpose for which they are designed, so any sort of tabular data is better handled with something like Pandas.
To start, we are going to import the two libraries numpy
and matplotlib that will be used in this episode.
Here we import the libraries using a common shorthand for them,
np for numpy, and plt for
matplotlib.pyplot. You will encounter this in many python
scripts using these libraries, and we will continue to use these
shorthands below.
If we wanted to create a list of odd numbers in base Python
we would use range and list:
OUTPUT
odds is type <class 'list'>, and contains [1, 3, 5, 7, 9]To create the same list as a NumPy array we can use the
np.arange function:
PYTHON
odds_np = np.arange(1, 10, 2)
print(f'odds_np is type {type(odds_np)}, and contains {odds_np}')
OUTPUT
odds_np is type <class 'numpy.ndarray'>, and contains [1 3 5 7 9]Note that we did not need to convert the output of
np.arange, as we did for the output of range,
because np.arange returns a NumPy array directly, rather
than returning a range object.
NumPy Array Addition
What is the difference between addition of NumPy arrays and lists? What is the result of these two additions?
-
[1, 3, 5, 7, 9, 1, 3, 5, 7, 9]for both -
[1, 3, 5, 7, 9, 1, 3, 5, 7, 9]for odds, and[2, 6, 10, 14, 18]for odds_np -
[2, 6, 10, 14, 18]for odds, and[1, 3, 5, 7, 9, 1, 3, 5, 7, 9]for odds_np -
[2, 6, 10, 14, 18]for both
The correct answer is (2)
Reshaping NumPy Arrays
NumPy arrays are multidimensional objects for storing data (not
necessarily numerical). The shape of the array can be modified using the
method reshape:
PYTHON
arr = np.arange(1, 18, 2)
arr_2d = arr.reshape((3, 3))
print(f'arr has shape {arr.shape}, and contains:')
print(arr)
print(f'arr_2d has shape {arr_2d.shape}, and contains:')
print(arr_2d)
OUTPUT
arr has shape (9,), and contains:
[ 1  3  5  7  9 11 13 15 17]
arr_2d has shape (3, 3), and contains:
[[ 1  3  5]
 [ 7  9 11]
 [13 15 17]]
Checking and changing the type of the data within the array is relatively straightforward:
OUTPUT
int64
float64
Working with Matrices
NumPy arrays are not matrix objects, but NumPy does provide a matrix object, which has the characteristics of a mathematical matrix:
OUTPUT
numpy.matrixThese can be used to carry out matrix multiplication:
OUTPUT
matrix([[ 87., 105., 123.],
        [213., 267., 321.],
        [339., 429., 519.]])
Masked Arrays
A very useful tool that NumPy provides for working with experimental data is the masked array. When you are taking data from an experiment you always have some data which are not present, or with a bad signal to noise ratio, or that you cannot use for some other reason. This function allows you to select which data you wish to work with within your dataset.
Masked arrays associate a NumPy array with another array composed only of boolean values (True or False). These tell NumPy whether to use (or not) the respective element.
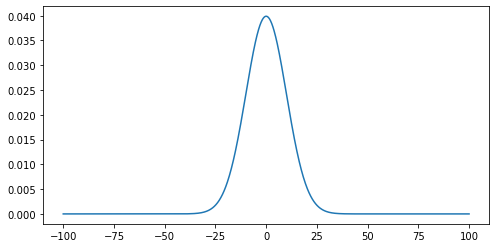
To demonstrate this we are going to create a Gaussian function and use it to generate an example dataset and generate a plot. We will then add some noise to it and use a masked array to filter out the noisy data. This represents the kind of processing that can be used for datasets such as a seismographs, where we would wish to isolate single events from noisy background data.
Reminder: the Gaussian function is defined by: 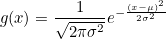
where x is an array, µ is the position of the centre of the curve/peak and σ is the width of the bell.
Gaussian Function
- Create a function called
gausswhich will take three arguments (inputs): x, µ, and σ, as defined above. Hint: you may wish to use the NumPy constantpi, and NumPy functionssquare,sqrtandexpfor calcuating the square, square-root and exponential of e respectively for all elements in an array. - Create a NumPy array using the Numpy function
linspacewhich will contain 1000 points equally spaced between x=-100 and x=100. Hint: You can print the help documentation of a function with ‘help(name_of_the_function)’. - Using the above gauss function and the array, create an array which contains the values of the Gaussian from x=-100 to x=100.
- Use the ‘matplotlib’ library to plot the curve with µ=0 and σ=10.
Noisy Signal
Now we are going to add some random noise to that curve. To do this
we need to create a Random Number Generator (RNG), which we can then use
with the function normal from the module
random provided by the NumPy library. We create an array of
zeros of the same length as the array for our curve g as
the mean values for the random noise, and then scale the magnitude of
the noise so it is (roughly) a 10th of the magnitude of the Gaussian
maximum. Finally, we then plot the result of adding the noise to the
original curve:
PYTHON
rng = np.random.default_rng()
zeros = np.zeros(len(g))
noise = rng.normal(zeros, g.max() / 10)
noisy = g + noise
plt.plot(x, noisy)
plt.show()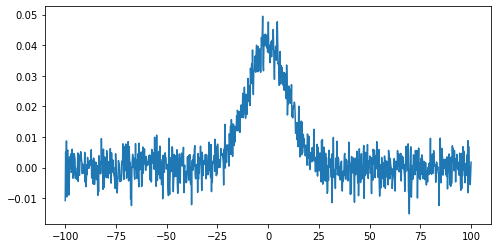
Matplotlib in Jupyter notebooks
By default, a Jupyter notebook evaluates and displays the final step
in a cell. In the case of the ‘matplotlib’ library’s
plot(...) function, this means that it automatically
displays a plot without requiring the show() function.
However, since this function is required in other scenarios (e.g. a
standalone python script), the course notes will include it each time it
is required.
To identify any signal in the data we can use the standard deviation as an estimate of the noise around the mean value of the data.
PYTHON
stddev_noisy = np.std(noisy)
mean_noisy = np.mean(noisy)
print(f'standard deviation is: {stddev_noisy:.5f}')
print(f'mean value is: {mean_noisy:.5f}')
OUTPUT
standard deviation is: 0.01159
mean value is: 0.00505
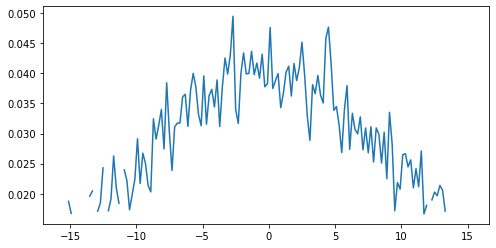
We will create a mask for the data, by selecting all data points below this threshold value (we’ll assume here that any signal we might be interested in is positive):
This creates an array of boolean values, the same shape as our
original data, with True values where the conditional
statement has been met.
The mask and noisy data can now be combined using the
array function of the NumPy masked arrays module
(np.ma). Any True value in the mask will
exclude the corresponding element from subsequent computation or
plotting:
Working with images
We are going to learn some commands that deal with images. Since most scientific domains use their own file format, we obviously can not learn all of them. We will use a typical astronomical image format: the ‘fits’ file.
In the data directory you should find a file called
502nmos.fits.
We need to use the astropy I/O library fits to open this file. This can be imported as:
The file can now be opened using:
Memory management for large files
By default pyfits opens a file with the option
memmap=True. This option opens the fits file without
copying the data into memory and allows us to open very large files
which will not fit into physical memory.
Fits files are composed of a list of HDUs (Header and data units). We
can list the information with the method info.
OUTPUT
Filename: data/502nmos.fits
No.    Name      Ver    Type      Cards   Dimensions   Format
  0  PRIMARY       1 PrimaryHDU     290   (1600, 1600)   float32
  1  502nmos_cvt.tab    1 TableHDU       353   1R x 49C   [D25.17, D25.17, E15.7, E15.7, E15.7, E15.7, E15.7, E15.7, E15.7, E15.7, A1, E15.7, I12, I12, D25.17, D25.17, A8, A8, I12, E15.7, E15.7, E15.7, E15.7, E15.7, E15.7, I12, I12, I12, I12, I12, I12, I12, I12, A48, E15.7, E15.7, E15.7, E15.7, E15.7, E15.7, E15.7, E15.7, E15.7, E15.7, E15.7, E15.7, E15.7, E15.7, E15.7]
Here we’re only interested in the primary HDU which is an image and
is called PRIMARY. The base file system can be accessed in the
same manner as a dictionary - using either the key
im1['PRIMARY'] or the index im1[0].
The image comprises of two parts: a header, and then the image data.
The header can be accessed using the header attribute:
OUTPUT
SIMPLE  =                    T / FITS STANDARD
BITPIX  =                  -32 / FITS BITS/PIXEL
NAXIS   =                    2 / NUMBER OF AXES
NAXIS1  =                 1600 /
NAXIS2  =                 1600 /
EXTEND  =                    T / There maybe standard extensions
BSCALE  =                1.0E0 / REAL = TAPE*BSCALE + BZERO
BZERO   =                0.0E0 /
OPSIZE  =                 2112 / PSIZE of original image
ORIGIN  = 'STScI-STSDAS'       / Fitsio version 21-Feb-1996
FITSDATE= '2005-07-01'         / Date FITS file was created
FILENAME= '502nmos_cvt.hhh'    / Original filename
...
To access the data we use the data attribute:
OUTPUT
numpy.ndarrayNote that this data is in the form of a NumPy array, and so we can use our standard NumPy tools for processing and displaying this data.
To start with we will look at the unprocessed image of the nebulae:
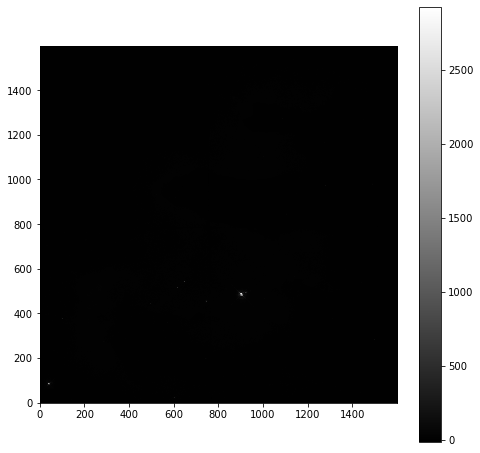
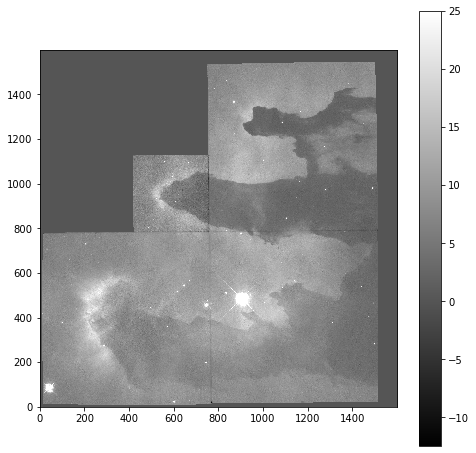
As is common for astronomical images, it is difficult to see anything on this image because a few very bright objects within the frame have saturated the CCD, and so a linear output shows only a limited number of pixels.
To improve the visible output we will carry out some simple analysis of the image, so that we can solve this contrast problem.
First we examine the general stats of the data (using built-in methods, except for the median, which has to be called from NumPy directly):
PYTHON
print(f'mean value im1: {imdata.mean()}')
print(f'median value im1: {np.median(imdata)}')
print(f'max value im1: {imdata.max()}')
print(f'min value im1: {imdata.min()}')
OUTPUT
mean value im1: 6.237272
median value im1: 6.7385635
max value im1: 2925.8718
min value im1: -12.439324
These show that, while the range is very large, the mean and median values are both very low, suggesting that there are only a few pixels with very high values.
This can be confirmed by plotting a histogram of the number of pixels vs the number of photons:
PYTHON
hist = plt.hist(imdata.ravel(), bins=100)
plt.xlabel('Number of Photons')
plt.ylabel('Pixel Count')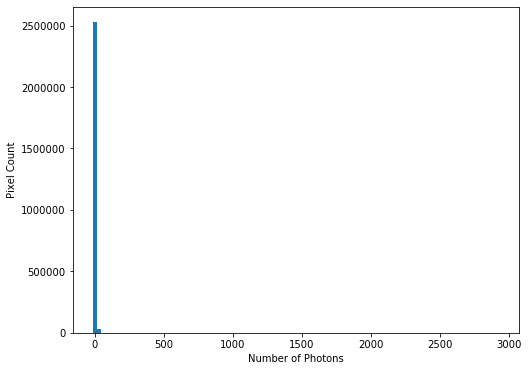
This confirms our suspicions that many pixels have very low photon counts.
Flattening N-D arrays
To plot a histogram of all the data we needed to flatten the two
dimensional data array. This was done using the built-in
ravel function.
To see the full range of photon counts we will use a log scale:
PYTHON
hist = plt.hist(imdata.ravel(), bins=100)
plt.yscale('log')
plt.xlabel('Number of Photons')
plt.ylabel('Pixel Count')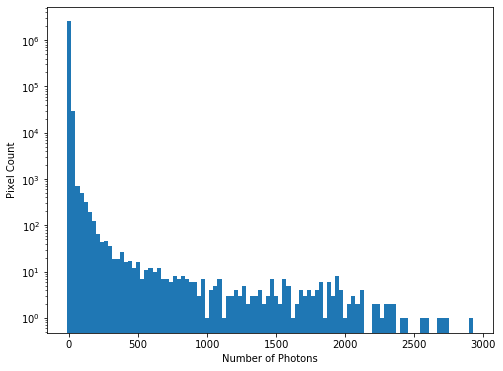
While almost all pixels have a photon count of zero (or near zero), only a few (<1000) photon counts are above 100. There does appear to be a significant number of pixels with values between these two extremes though, so we will constrain the range of our x-axis to between the limits of 1 and 30, to better see these data. The limit of 30 is obtained through previous analysis - if you were carrying out this investigation of the data yourself you would use trial and error to find the best cut-off point for this plot.
PYTHON
hist = plt.hist(imdata.ravel(), bins=100, range=(1,30))
plt.xlabel('Number of Photons')
plt.ylabel('Pixel Count')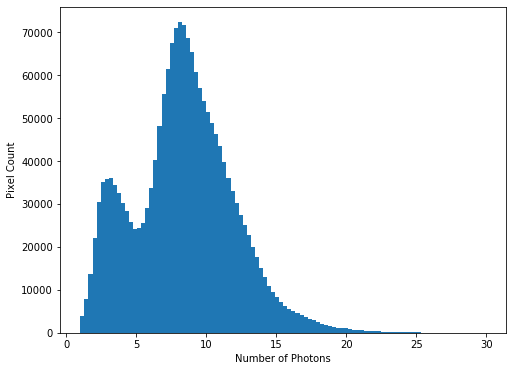
We see that there is a bi-modal distribution, with the largest peak around 8-9 photons, and a smaller peak around 3-4 photons.
Now that we can see that the majority of the data is below a photon count of 25, we can start manipulating our image plot to see more details of the nebulae:
Masked Arrays (part 2)
Rather than applying the filtering of our data within the plotting tool, we can instead use masked arrays to filter our data. This allows for more nuanced filtering of the data.
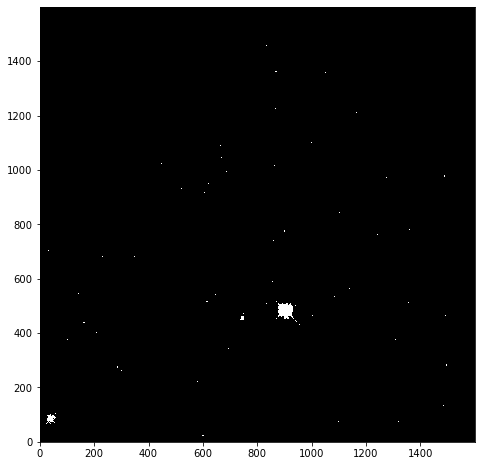
We begin with creating a mask to remove values greater than 25:
The immasked array contains the imdata data
(you can test this by plotting immasked using
imshow as we did at the start of this section). It also
contains an attribute mask, which is applied to filter the
data when it is plotted. We can plot this directly to see what is being
removed:
This mask is applied to the data for all built-in functions. But
where we have to directly use a NumPy function we have to make sure we
use the equivalent function in the mask (ma) library:
PYTHON
print(f'original average: {imdata.mean()}')
print(f'Masked average: {immasked.mean()}\n')

print(f'original max: {imdata.max()}')
print(f'Masked max: {immasked.max()}\n')

print(f'original min: {imdata.min()}')
print(f'Masked min: {immasked.min()}\n')

print(f'original median: {np.mean(imdata)}')
print(f'Masked median: {np.ma.median(immasked)}')
OUTPUT
original average: 6.237272
Masked average: 5.976717048232941

original max: 2925.8718
Masked max: 24.981937

original min: -12.439324
Masked min: -12.439324

original median: 6.237272
Masked median: 6.725283622741699Removing negative photon counts
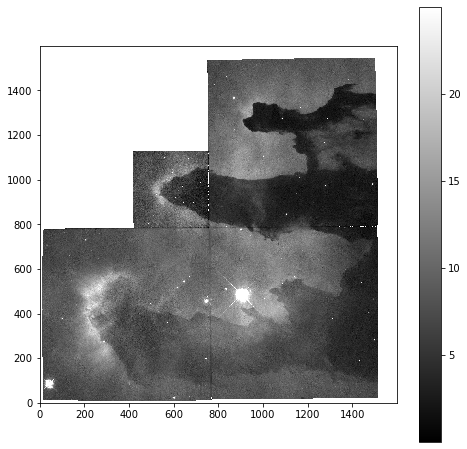
Photon counts cannot be negative, but some of our data is (some is due to no measurements being taken, and some is also likely due to sampling errors). So we would like to remove these erroneous data from our plot too.
- Create a new masked array (
immasked2) where the lower limit is set to zero (you can use thenp.ma.masked_less_equalfunction to do this). - Update the immasked2.mask to apply both masks (you can use the
logical OR operator
|to do this). Then plot the new masked data array.
- NumPy arrays are not matrix objects
- Array masks can be created using conditional statements
- NumPy arrays can be masked to hide data you don’t want to include in an analysis
- NumPy libraries are available for reading a lot of different file formats
Content from Units and Quantities
Last updated on 2026-10-30 | Edit this page
Overview
Questions
- How can I ensure consistent units in my code?
Objectives
- Creating quantity objects which include values and units
- Applying unit conversions
- Learn about different types of equivalence for units
- Using units for annotating plots
- Test different unit libraries
One of the most common problems in physics and the development of physical models is related to the conversion and management of physical units. Without clear management of physical units, and ensuring that the information passed between different parts of the system is consistent, accidents such as the Mars Climate Orbiter probe crash can occur.
In this lesson we will look at one of the available libraries in python for helping to avoid such problems. This is the units module in the astropy library.
Importing a module from a python library
The units module can then be imported in your scripts
using:
Importing as u is not necessary, but it is a common
shorthand for this module, and so we’ll use it below.
As you are likely using the Jupyter interface to follow this lesson,
it is likely that the astropy library will already be
installed there. If not, then you may encounter an error when running
this command. We will go into more detail on installing packages in a
later lesson; for now, installing the library will depend on how you set
your environment up initially; if you used pip (or are in
Jupyter and astropy doesn’t work), then you need to use
Alternatively, if you installed some form of conda, then
you can use
We will go into more detail about conda in a later
lesson.
Basics
Units can be added to a python variable by multiplying that variable by the unit:
(note the use of US spellings for units).
When printing the variable the unit information will now be attached:
OUTPUT
26.2 mThe type of this new variable is an astropy
Quantity:
OUTPUT
astropy.units.quantity.QuantityYou can still access the original object using
value:
OUTPUT
26.2
float
Quantities can be converted to other units, systems or factors, by
using the function to(). For example:
This enables the use of arithmetic operations when quantities have compatible units:
PYTHON
distance_start = 10 * u.mm
distance_end = 20 * u.km
length = distance_end - distance_start
print(length)
OUTPUT
19.99999 kmAnd it also enables the combining of quantities, for example, to calculate a speed:
OUTPUT
3.0 km / minBy default the units library will select units to report for these values based on what the units are of the objects that you have passed it. You can, as before, convert these to the units of your choice:
OUTPUT
0.05 km / sYou can also convert the units to the base (irreducible) units for
the unit system you are using with the decompose function
(changing the unit system choice will be covered later):
OUTPUT
50.0 m / sChoosing different base units
If you wish to reduce to different base units you can pass a list of
those units to the bases parameter when calling the
decompose function:
OUTPUT
0.05 km / sNote that the order of the values in the list passed to the
bases parameter doesn’t matter. However, the base units you
choose must be either one of the original units used, or a standard base
unit. This function cannot be used to convert from km to cm, for
example. Instead it is useful where you only want to reduce select units
within the object.
You can change the base system using functions such as
si (to change to the default SI units) and cgs
(to change to centimetre-grams-seconds units):
OUTPUT
5000.0 cm / sReducing more complex quantities
We have been given some (slightly messy) code that calculates the jerk, or rate
of change of acceleration, of a vehicle in the units
m/h/min^2:
PYTHON
acceleration = (25 * u.meter) / (15 * u.minute) / (15 * u.minute)
time_change = 1 * u.hour
jerk = acceleration / time_change
print(jerk)
OUTPUT
0.11111111111111112 m / (h min2)For the report we are writing we need to convert this to the units
km/hour^3, which of these changes will do this task for
us?
jerk.decompose(bases=['km','hr'])jerk.to(u.km/u.hour**3)jerk.to(u.km/u.hour**2)
Answer 2 is correct. Decompose will only reduce to base units (or existing units), and so can’t change minutes to hours, or metres to kilometres. Answer 3 won’t work, because we have to apply the modification to all units (including those which are already correct).
Imperial Units
The units library is focused on scientific notation. To
use units from the (US) imperial system we can import the
imperial library:
These can then be used in the same manner as the standard units:
OUTPUT
111.84681 mi/hEquivalent Units
There are some unit conversions that would initially appear to be
unconvertible. For example, it is possible to convert meters into Hertz.
At first glance it seems to be wrong but if you know the quantities for
wavelength and frequencies, it is indeed a valid conversion:  where:
- lambda ~ m
- c ~ m/s
- ~ Hz ~ 1/s
This, however, does not work as above:
OUTPUT
UnitConversionError: 'nm' (length) and 'Hz' (frequency) are not convertibleInstead we need to inform units what unit equivalency we
want it to use, which can be specified with the
equivalencies option:
OUTPUT
4.5680502×10^14 HzIn this case we use the spectral equivalence library,
which allows conversions between wavelengths, wave number, frequency,
and energy equivalent pairs. There are a number of other built-in
equivalency libraries, for commonly used pairings.
Other built-in equivalencies are:
- Doppler (
doppler_radio,doppler_optical,doppler_relativistic) - spectral flux density
- temperature
- brightness temperature
- temperature energy
- and you can build your own
Finding equivalencies is possible using the
find_equivalent_units function:
OUTPUT
  Primary name | Unit definition | Aliases
[
  Bq           | 1 / s           | becquerel    ,
  Ci           | 3.7e+10 / s     | curie        ,
  Hz           | 1 / s           | Hertz, hertz ,
]
This is a quite limited list - to see what is available for other equivalence libraries, we must specify these when making the request:
OUTPUT
  Primary name | Unit definition        | Aliases
[
  AU           | 1.49598e+11 m          | au, astronomical_unit            ,
  Angstrom     | 1e-10 m                | AA, angstrom                     ,
  Bq           | 1 / s                  | becquerel                        ,
  Ci           | 3.7e+10 / s            | curie                            ,
  Hz           | 1 / s                  | Hertz, hertz                     ,
  J            | kg m2 / s2             | Joule, joule                     ,
  Ry           | 2.17987e-18 kg m2 / s2 | rydberg                          ,
  cm           | 0.01 m                 | centimeter                       ,
  eV           | 1.60218e-19 kg m2 / s2 | electronvolt                     ,
  earthRad     | 6.3781e+06 m           | R_earth, Rearth                  ,
  erg          | 1e-07 kg m2 / s2       |                                  ,
  jupiterRad   | 7.1492e+07 m           | R_jup, Rjup, R_jupiter, Rjupiter ,
  k            | 100 / m                | Kayser, kayser                   ,
  lyr          | 9.46073e+15 m          | lightyear                        ,
  m            | irreducible            | meter                            ,
  micron       | 1e-06 m                |                                  ,
  pc           | 3.08568e+16 m          | parsec                           ,
  solRad       | 6.957e+08 m            | R_sun, Rsun                      ,
]
Angles
The numpy trigonometry functions (np.sin,
np.cos, etc) require angles that are passed to them to be
in radians, rather than degrees. It is inconvenient to have to
explicitly convert from other units to radians every time that you wish
to use these functions, but with units you can have this done implicitly
for you.
The radian unit is u.rad, and it’s equivalencies
are:
OUTPUT
  Primary name | Unit definition | Aliases
[
  arcmin       | 0.000290888 rad | arcminute ,
  arcsec       | 4.84814e-06 rad | arcsecond ,
  cycle        | 6.28319 rad     | cy        ,
  deg          | 0.0174533 rad   | degree    ,
  hourangle    | 0.261799 rad    |           ,
  mas          | 4.84814e-09 rad |           ,
  rad          | irreducible     | radian    ,
  uas          | 4.84814e-12 rad |           ,
]
We can see from this that the degree unit is u.deg, so
we can use this to define our angles:
PYTHON
angle = 90 * u.deg
print(f'angle in degrees: {angle.value}; and in radians: {angle.to(u.rad).value}')
OUTPUT
angle in degrees: 90.0; and in radians: 1.5707963267948966Now we can pass the angle directly to np.sin without
having to convert directly to radians:
PYTHON
import numpy as np

print(f'sin of 90 degrees is: {np.sin(angle)}')
print(f'sin of pi/2 radians is: {np.sin(1.57079632)}')
print(f'sin of 90 degrees is not: {np.sin(90)}')
OUTPUT
sin of 90 degrees is: 1.0
sin of pi/2 radians is: 1.0
sin of 90 degrees is not: 0.8939966636005579
Plotting Quantities
Support has been added for using the units information in matplotlib
plots. To use this we need to import the quantity_support
library:
We will create a numpy array of the angles between 0-180 degrees, and plot the sin of these:
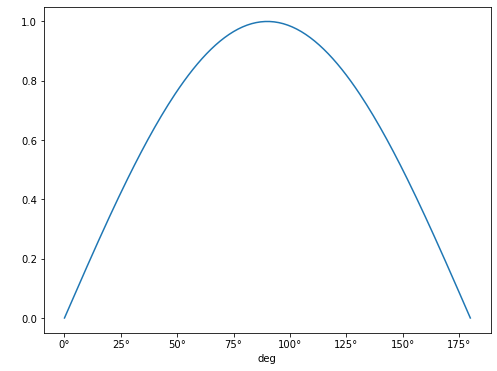 Note that the units
for the x-axis are properly presented. This can be done for any angular
unit we wish:
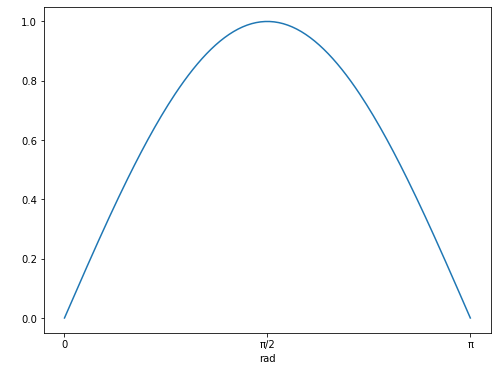
NOTE The call to quantity_support() is required to
“patch” matplotlib to recognize the
astropy.units, and it will affect anything you plot from
that point onward. If you only need quantity_support for
some plots, you can use a context manager:
Temperature
Each of the temperature scales is considered as using an irreducible
unit in standard usage. As a consequence of this we need to always
specify that we are using the u.temperature equivalences
when we convert between these:
PYTHON
t2 = 1 * u.deg_C
t2_deg_f = t2.to(imperial.Fahrenheit, equivalencies=u.temperature())
print(f'{t2} is equivalent to {t2_deg_f}')
OUTPUT
1.0 deg_C is equivalent to 33.8 deg_FBut, be aware that these are scales, if we wanted to increase a temperature given in Fahrenheit by 1 degree Celsius, we would not add 33.8 degrees Fahrenheit!
To get the incremental value of 1 degree Celsius in Fahrenheit we would need to do this:
PYTHON
t1 = 0 * u.deg_C
t2 = 1 * u.deg_C
t1_deg_f = t1.to(imperial.Fahrenheit, equivalencies=u.temperature())
t2_deg_f = t2.to(imperial.Fahrenheit,equivalencies=u.temperature())
print(f'{t2 - t1} increment is equivalent to a {t2_deg_f - t1_deg_f:.1f} increment')
OUTPUT
1.0 deg_C increment is equivalent to a 1.8 deg_F incrementThis is verging on unreadable (as is demonstrated by us having to split a simple arithmetic expression involving two variables across several lines of code).
Fortunately there is support for cleaner temperature conversions in
the pint
package. This has similar functionality to the astropy.unit
package, but has been built from the ground up with a focus on different
aspects. These include unit parsing and standalone unit definitions,
uncertainties integration, and (important for our example here), cleaner
treatment of temperature units.
The unit registry is loaded using:
A units definition file could be given here if needed, but in this case we will stick with the default settings.
This library has the temperature units as before:
OUTPUT
1 degree_Celsius is equivalent to 33.8 degree_FahrenheitBut it also includes the concept of temperature increments:
PYTHON
deltaT = 1 * ureg.delta_degC
print(f'{deltaT} is equivalent to {deltaT.to(ureg.delta_degF):.1f}')
OUTPUT
1 delta_degree_Celsius is equivalent to 1.8 delta_degree_FahrenheitBecause of the popularity of python this overlap of functionality of packages can be common. We would recommend exploring the different available packages that might cover your requirements before settling on one. And keep watching out for new packages, and be prepared to switch when starting new projects if/when you find better packages.
-
astropy.unitslibrary provides unit support -
Quantityobjects are created by multiplying values by the desired units - The
.to()function can be used to convert units - The
.decompose()function can be used to convert to the base (irreducible) units - Equivalences can be found using the
.find_equivalent_units()function - Specific equivalence libraries can be defined using the
equivalences=keyword - Import quantity-support from
astropy.visualizationto integrate units with matplotlib for data plotting - The
pintlibrary provides similar unit support, but is better for working with temperature increments
Content from Pandas Essential
Last updated on 2026-10-30 | Edit this page
Overview
Questions
- How can I work with spreadsheet style datasets?
Objectives
- Learn to load csv data, and obtain simple analyses of the data
- Learn how to index data arrays using column/row labels
- Learn how to mask data to remove unwanted values
- Learn how to plot data directly from pandas
This library is based on the numpy library that we discuss in a previous lesson. It provides python users with a new object that allows us to work with “relational” or “labelled” data in an easy way. It provides similar access to data loaded from databases or spreadsheets as those found in languages like R.
Pandas is designed more for data science than pure numerical analysis but the required tools can easily be combined together. In addition, the library provides input/output tools that allow the opening and saving of data from MS Excel, CSV or HDF5 files.
The library is usually imported as pd:
Later we will need to plot data - so the matplotlib library should be loaded:
We will be working with data in the
data/gapminder_gdp_europe.csv file. Open this with a text
editor and look at the data layout.
The data within this file is organised much as you’d expect the data
within a spreadsheet. The first row of the file contains the headers for
each of the columns. The first column contains the name of the
countries, while the remaining columns contain the GDP values for these
countries for each year. Pandas has the read_csv function
for reading structured data such as this, which makes reading the file
easy:
Here we specify that the country column should be used
as the index column (index_col).
This creates a DataFrame object containing the dataset.
This is similar to a numpy array, but has a number of significant
differences. The first is that there are more ways to quickly understand
a pandas dataframe. For example, the info function gives an
overview of the data types and layout of the DataFrame:
OUTPUT
<class 'pandas.core.frame.DataFrame'>
Index: 30 entries, Albania to United Kingdom
Data columns (total 12 columns):
 #   Column          Non-Null Count  Dtype
---  ------          --------------  -----
 0   gdpPercap_1952  30 non-null     float64
 1   gdpPercap_1957  30 non-null     float64
 2   gdpPercap_1962  30 non-null     float64
 3   gdpPercap_1967  30 non-null     float64
 4   gdpPercap_1972  30 non-null     float64
 5   gdpPercap_1977  30 non-null     float64
 6   gdpPercap_1982  30 non-null     float64
 7   gdpPercap_1987  30 non-null     float64
 8   gdpPercap_1992  30 non-null     float64
 9   gdpPercap_1997  30 non-null     float64
 10  gdpPercap_2002  30 non-null     float64
 11  gdpPercap_2007  30 non-null     float64
dtypes: float64(12)
memory usage: 3.0+ KB
You can also carry out quick analysis of the DataFrame using the
describe function:
OUTPUT
 	gdpPercap_1952 	gdpPercap_1957 	gdpPercap_1962  ...
count 	30.000000 	30.000000 	30.000000 ...
mean 	5661.057435 	6963.012816 	8365.486814 ...
std 	3114.060493 	3677.950146 	4199.193906 ...
min 	973.533195 	1353.989176 	1709.683679 ...
25% 	3241.132406 	4394.874315 	5373.536612 ...
50% 	5142.469716 	6066.721495 	7515.733738 ...
75% 	7236.794919 	9597.220820 	10931.085347 ...
max 	14734.232750 	17909.489730 	20431.092700 ...
Accessing elements, rows, and columns
The other major difference to numpy arrays is that we cannot directly
access the array elements using numerical indices such as
df[0,0]. It is possible to access columns of data using the
column headers as indices (for example,
df['gdpPercap_1952']), but this is not recommended. Instead
you should use the iloc and loc methods.
The iloc method enables us to access the DataFrame as we
would a numpy array:
while the loc method enables the same access using the
index and column headers:
For both of these methods, we can leave out the column indexes, and these will all be returned for the specified index row:
This will not work for column headings (in the inverse of the
df['gdpPercap_1952'] method) however. While it is quick to
type, we recommend trying to avoid using this method of slicing the
DataFrame, in favour of the methods described below.
For both of these methods we can use the : character to
select all elements in a row or column. For example, to get all
information for Albania:
or:
Note that here we knew that Albania was the first country in the
DataFrame, so we were able to ask for the first column (0). If you
needed to know the column ID for a particular country, you could do this
using get_loc(), e.g. to get the column ID value for
France:
The : character by itself is shorthand to indicate all
elements across that index, but it can also be combined with index
values or column headers to specify a slice of the DataArray:
If either end of the slice definition is omitted, then the slice will
run to the end of that index (just as it does for : by
itself):
Slices can also be defined using a list of indexes or column headings:
PYTHON
year_list = ['gdpPercap_1952','gdpPercap_1967','gdpPercap_1982','gdpPercap_1997']
country_list = ['Albania','Belgium']
print(df.loc[country_list, year_list])
OUTPUT
         gdpPercap_1952  gdpPercap_1967  gdpPercap_1982  gdpPercap_1997
country
Albania     1601.056136     2760.196931     3630.880722     3193.054604
Belgium     8343.105127    13149.041190    20979.845890    27561.196630
Masking data
Pandas Dataframes are based on numpy arrays, and retain some of the numpy tools, such as masked arrays. This enables us to apply selection criteria to the Dataframes, so that only the values that we require are shown. For example, the following selects all data where the GDP is above $10,000:
PYTHON
subset = df.loc['Italy':'Poland', 'gdpPercap_1962':'gdpPercap_1972']
print(subset[subset>10000])
OUTPUT
             gdpPercap_1962  gdpPercap_1967  gdpPercap_1972
country
Italy                   NaN     10022.40131     12269.27378
Montenegro              NaN             NaN             NaN
Netherlands     12790.84956     15363.25136     18794.74567
Norway          13450.40151     16361.87647     18965.05551
Poland                  NaN             NaN             NaN
Plotting from Pandas
Pandas is integrated with matplotlib, and so data can be plotted
directly using the integrated plot method. For example, to
plot the GDP for Sweden:
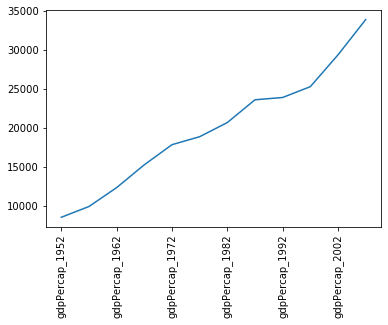
Note that we’ve had to rotate the xtick labels by 90 degrees, because they do not fit neatly under the x-axis. Later we will clean these up properly.
Note that, in the case above, we passed a single column of data to
the plot method - which it automatically transposed in
order to make sense of the plot request (because this method usually
works on rows of data). If you want to plot more than one column of data
you will need to explicitly transpose the DataFrame yourself.
For example, we will transpose the GDP data for the first 3 countries in our dataset:
OUTPUT
country             Albania       Austria       Belgium
gdpPercap_1952  1601.056136   6137.076492   8343.105127
gdpPercap_1957  1942.284244   8842.598030   9714.960623
gdpPercap_1962  2312.888958  10750.721110  10991.206760
gdpPercap_1967  2760.196931  12834.602400  13149.041190
gdpPercap_1972  3313.422188  16661.625600  16672.143560
gdpPercap_1977  3533.003910  19749.422300  19117.974480
gdpPercap_1982  3630.880722  21597.083620  20979.845890
gdpPercap_1987  3738.932735  23687.826070  22525.563080
gdpPercap_1992  2497.437901  27042.018680  25575.570690
gdpPercap_1997  3193.054604  29095.920660  27561.196630
gdpPercap_2002  4604.211737  32417.607690  30485.883750
gdpPercap_2007  5937.029526  36126.492700  33692.605080
This data is now ready to be plotted as a histogram - first we set the style of the plot to match that of the ggplot package in R:
PYTHON
plt.style.use('ggplot')
df.iloc[0:3,:].T.plot(kind='bar')
plt.xticks(rotation=90)
plt.ylabel('GDP per capita')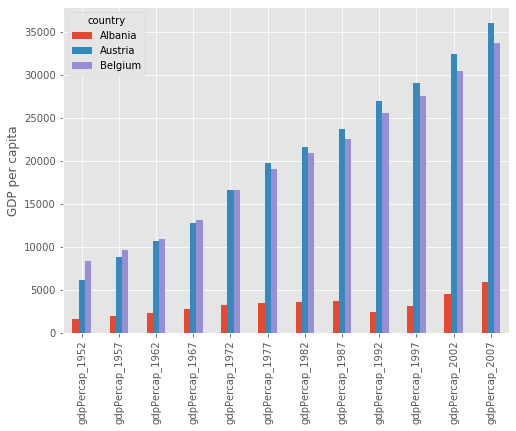
Saving figures created by pandas
Some python interpreters will, when creating a figure, present you with a graphical interface that you can use to save the figure. If, however, your interface does not do this (or you are writing a script which will automatically generate and save the figures), then you will first need to define a matplotlib figure object, and ensure that pandas plots your figure inside this.
To do this create a matplotlib subplots object, with handles for the
figure (fig) and axis (axs) objects. Pass the
axis object to pandas when plotting your figure (ax=axs),
then use the figure object at the end to save the figure
(fig.savefig).
Changing Column Labels
Note that the x-tick labels have been taken directly from the index values of the transposed DataFrame (which were the original column labels). These don’t really need to be more than the year of the GDP values, so we could change the column labels to reflect this.
First we make a new copy of the DataFrame (in case anything goes wrong):
We have given this new DataFrame a more appropriate name, replacing the information that will be removed from the column headers.
Now we will use the inbuilt str.strip method to clean up
our column labels for the new DataFrame. Which of these commands is
correct:
df_gdpPercap.columns = df.columns.str.strip('gdpPercap_')df_gdpPercap = df.columns.str.strip('gdpPercap_')
The correct answer is 1. We have to pass the new column labels explicitly back to the array columns, otherwise all we do is replace the DataFrame with a list of the new column labels.
Plotting GDP increases with time
Now that we’ve cleaned up the column labels, we now want to plot the GDP data for Sweden and Iceland from 1972 onwards. The code block we will be using is:
PYTHON
df_gdpPercap<BLOCK>.T.plot(kind='line')

# Create legend.
plt.legend(loc='upper left')
plt.xlabel('Year')
plt.ylabel('GDP per capita ($)')
Which of the following blocks of code should replace the
<BLOCK> in the code above?
.loc['Sweden':'Iceland','1972':].loc['1972':,['Sweden','Iceland']].loc[['Sweden','Iceland'],'1972':].loc['1972':,'Sweden':'Iceland']
The correct answer is 3. The two countries are not adjacent in the
dataset, so we need to use a list to slice them, not a range
(disqualifying answers 1 and 4). At the point where we select the
countries using .loc, we have not yet transposed the
DataFrame (using .T), so the country names are still
indexes, not column labels, and therefore need to be referenced first
(ie in the first set of square brackets), (disqualifying answers 2 and
4).
- CSV data is loaded using the
read_csv()function to create a pandasDataFrameobject - The
describe()function gives a quick analysis of the DataFrame -
loc[<index>,<column>]indexes the DataFrame by the index and column labels -
iloc[<index>,<column>]indexes the DataFrame using numerical indices - The data can be sliced by providing index and/or column indices as ranges or lists of values
- The built-in
plot()function can be used to plot the data using thematplotliblibrary
Content from User interfaces in Python
Last updated on 2026-10-30 | Edit this page
Overview
Questions
- What can you use for a user interface in Python?
- How do you … in Python?
Objectives
- Learn about designing user interfaces
- Learn about …
Add an introduction here
User interfaces
User interfaces. Streamlit?
The correct answer is
Another section
This is another section
Callout
This is a callout
- user interfaces
- Streamlit
Content from Data analysis workflows in Python
Last updated on 2026-10-30 | Edit this page
Overview
Questions
- How do you do data analysis workflows in Python?
- How do you …
Objectives
- Learn about how to structure a data analysis workflow in python
- Learn about …
Add an introduction here
Data analysis workflows in Python
Data analysis in Python
The correct answer is
Workflows in Python
Workflows
Workflows in other languages
Workflows in other programming languages
- Data analysis
- Workflows