Chapter 3
Producing plots
Plotting a “gapminder” graph
In order to avoid getting bogged down on the syntax of ggplot2, a function to produce a “gapminder” plot is provided in the workshopFunctions.R file, which we load at the start of our app (See git:02_loaddata ). This uses ggplot2 to produce a graph, deals with setting fixed axes, consistent colours etc.
If you haven’t already, set R’s working directory to that of your app (setwd("~/myworkshop/gapminder)). Then manually execute the lines of code that load the libraries, data and code by selecting them and pressing Ctrl+Enter.
Having loaded the data, libraries and functions, we can produce a gapminder plot in R using the following code:
gapminder %>%
  filter(year == 2000) %>%
  produceGapminderPlot()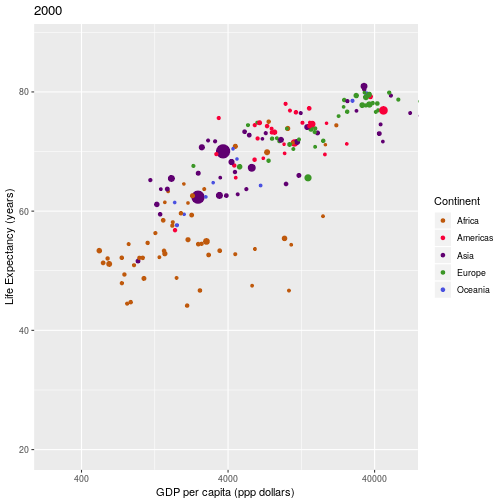
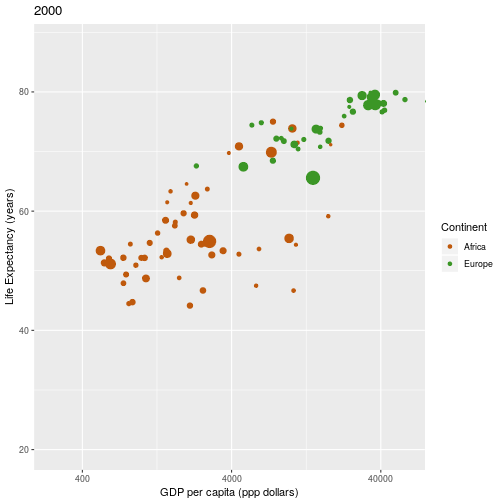
Exercise:
Add another filter to the example to only show countries that are in Europe and Africa
Solution:
Further examples of using the plotting functions are given in the codeExamples.R file, which is in ~/mawdsley