Image 1 of 1: ‘Chest X-ray diseases’
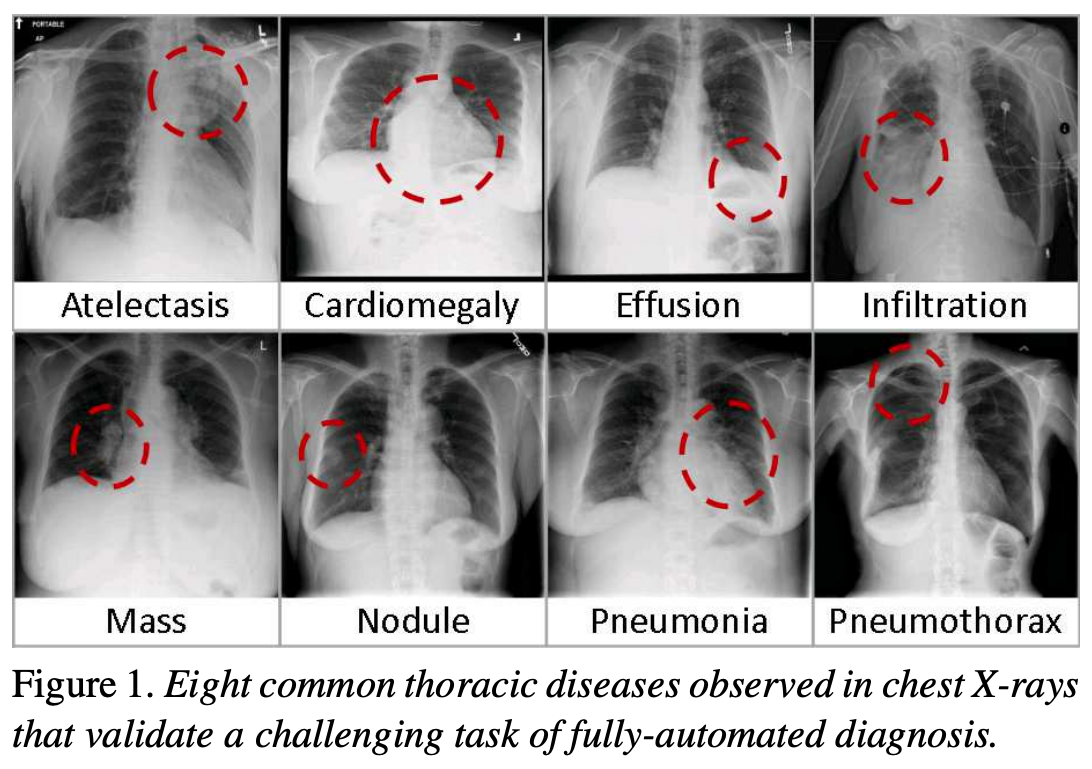
Image 1 of 1: ‘Example X-rays’
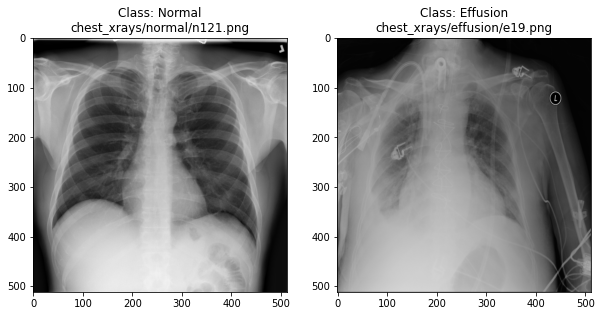
Example X-rays
Image 1 of 1: ‘RGB image’
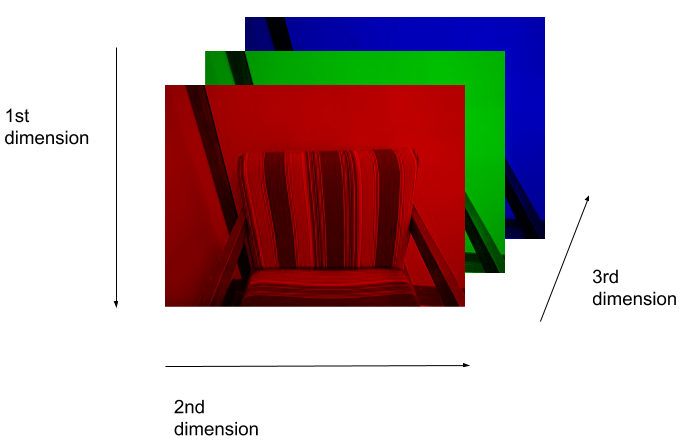
RGB image
Image 1 of 1: ‘Example greyscale numpy array’
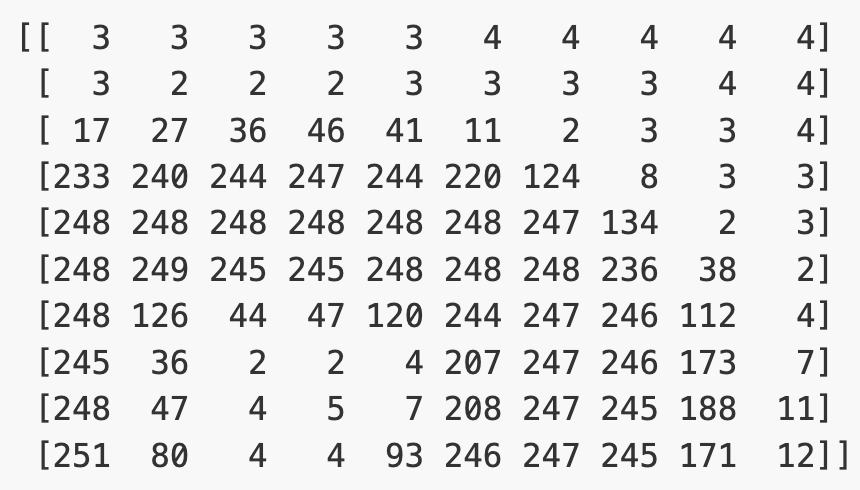
Example greyscale numpy array
Image 1 of 1: ‘Example greyscale image’
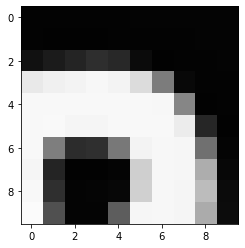
Example greyscale image
Image 1 of 1: ‘Final example image’
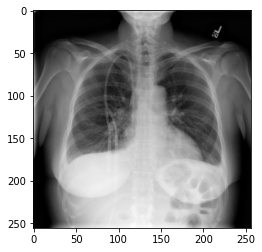
Final example image
Image 1 of 1: ‘Accessing a single value’

Image 1 of 1: ‘Accessing a submatrix’

Image 1 of 1: ‘Accessing strided rows and columns’

Image 1 of 1: ‘Accessing a row’

Image 1 of 1: ‘Accessing multiple rows’

Image 1 of 1: ‘Accessing multiple columns’

Image 1 of 1: ‘Accessing strided columns’

Image 1 of 1: ‘X-ray augmented’
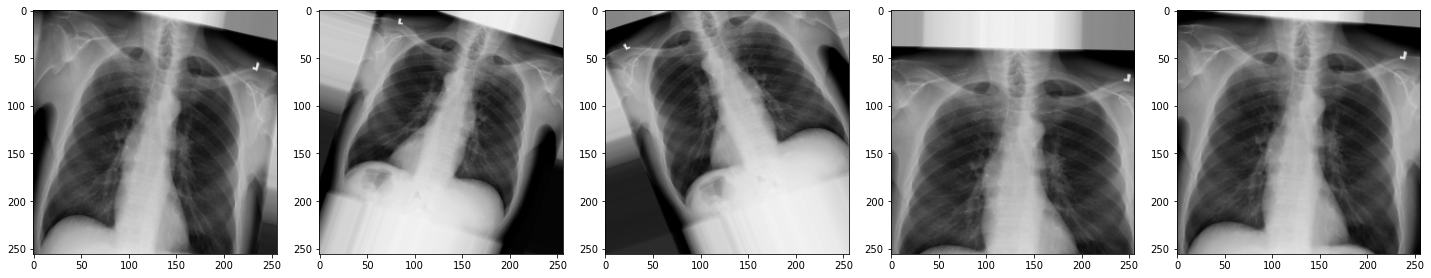
X-ray augmented
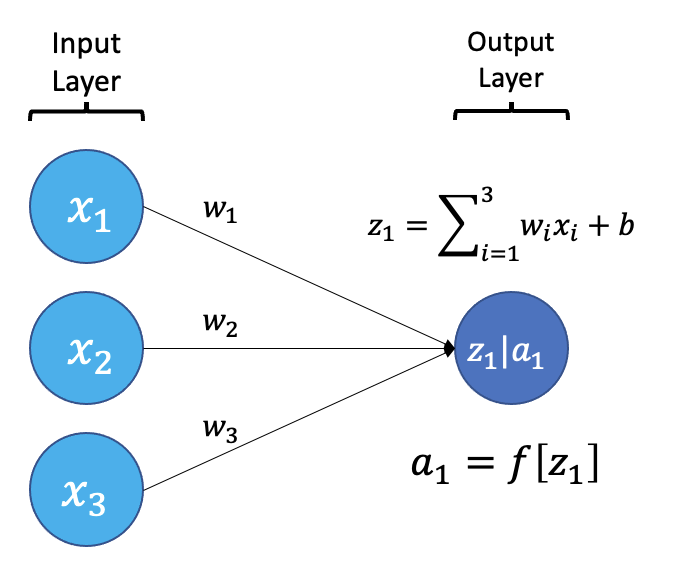
Image 1 of 1: ‘An example neuron receiving input from 3 other neurons’
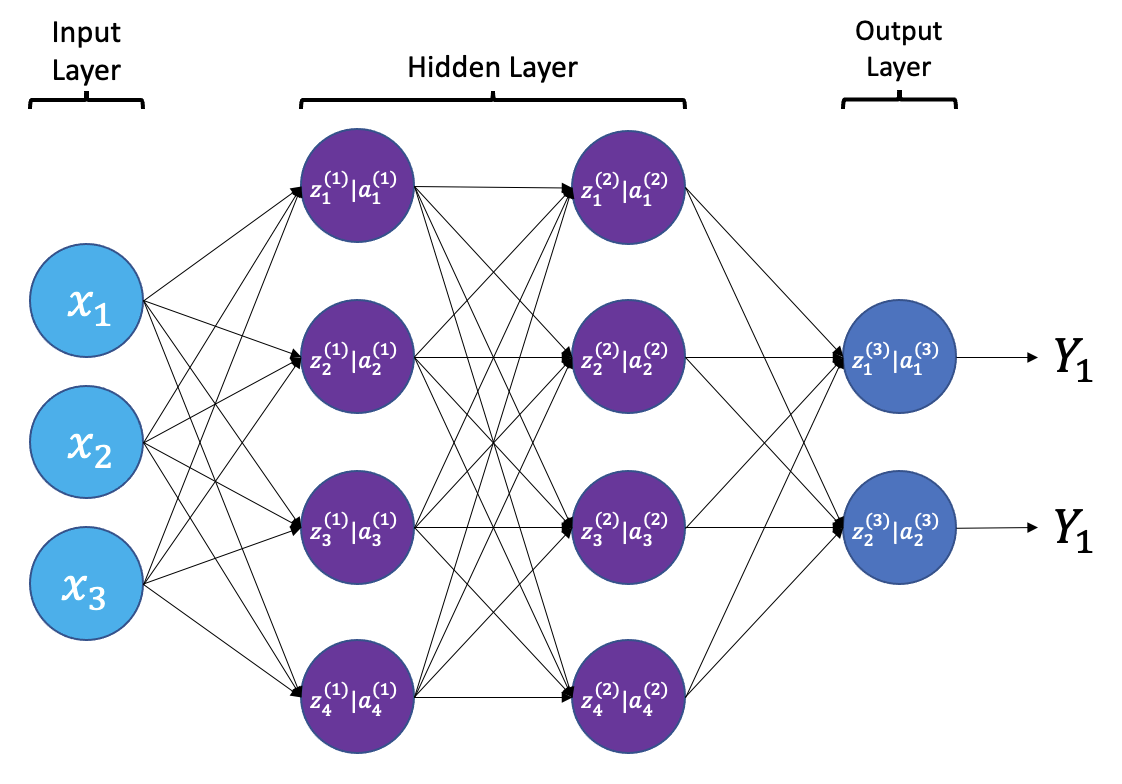 {a;t=“A simple neural
network with input, output, and 2 hidden layers”}
{a;t=“A simple neural
network with input, output, and 2 hidden layers”}
Image 1 of 1: ‘Plots of the Sigmoid, Tanh, ReLU, and Leaky ReLU activation functions’
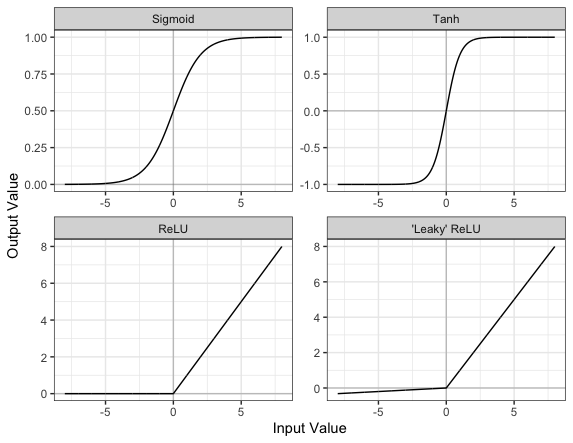
Image 1 of 1: ‘2D Convolution Animation by Michael Plotke’
Image 1 of 1: ‘Average inflammation’
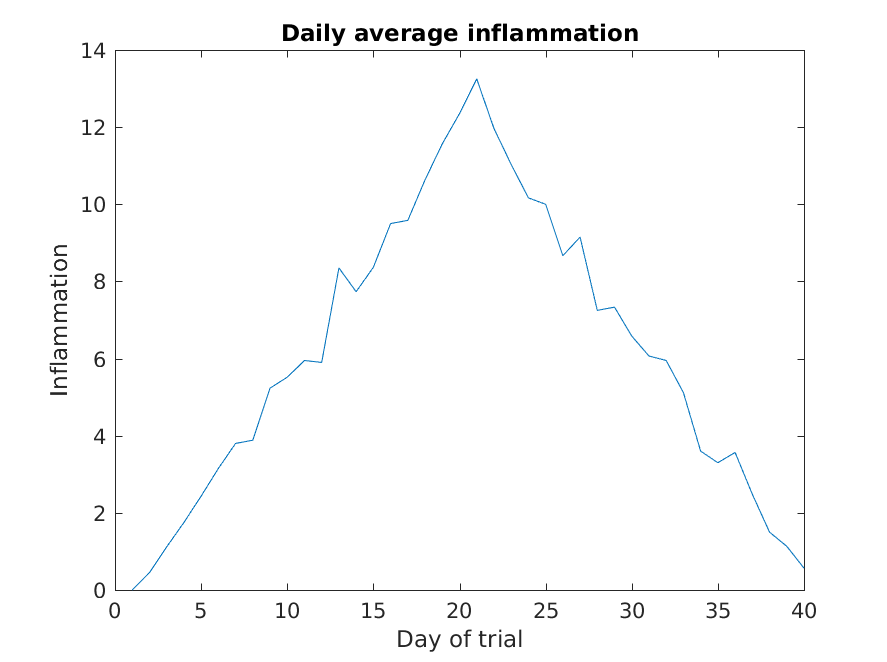
Image 1 of 1: ‘Maximum inflammation’
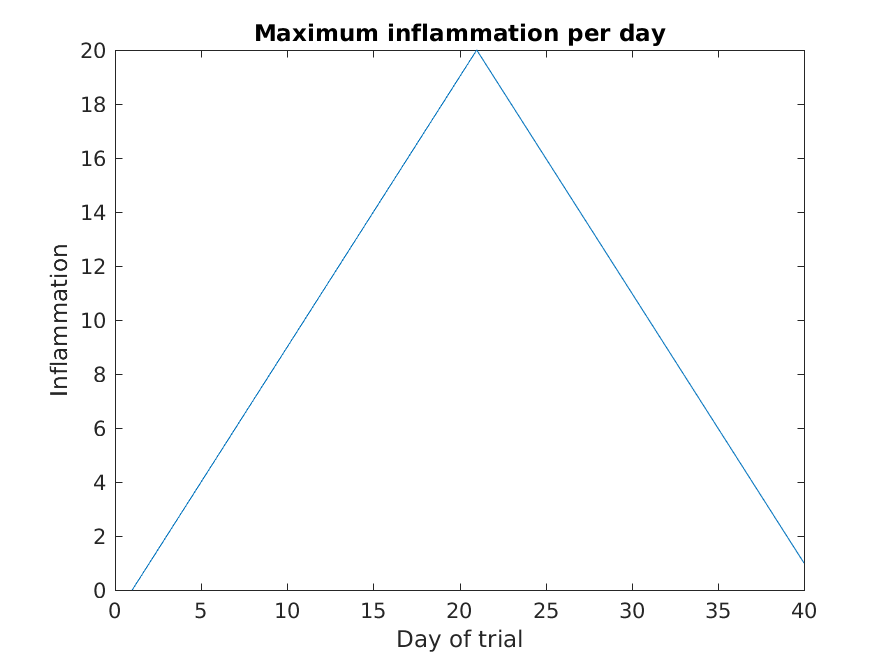
Image 1 of 1: ‘Minumum inflammation’
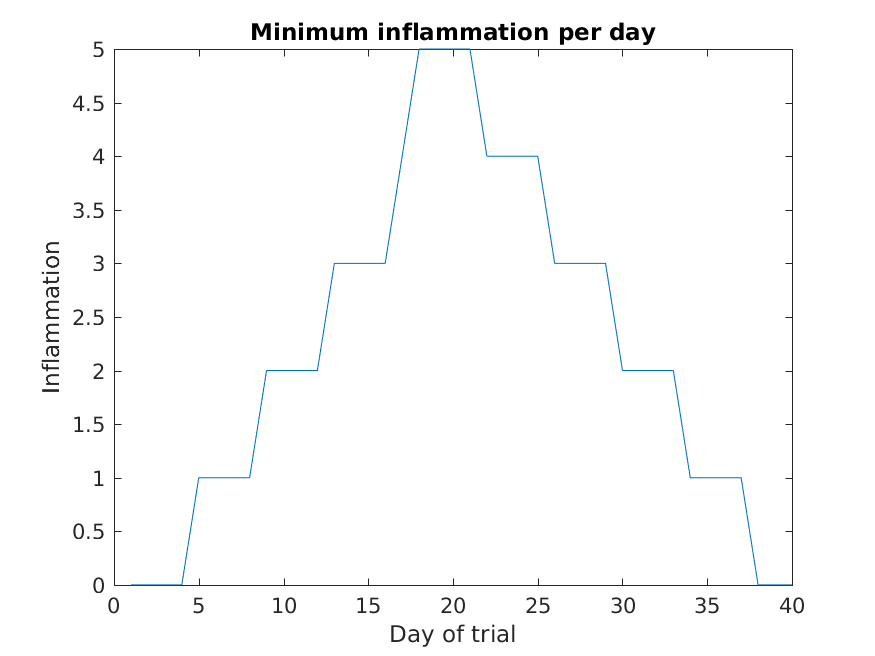
Image 1 of 1: ‘Average inflamation with legend’
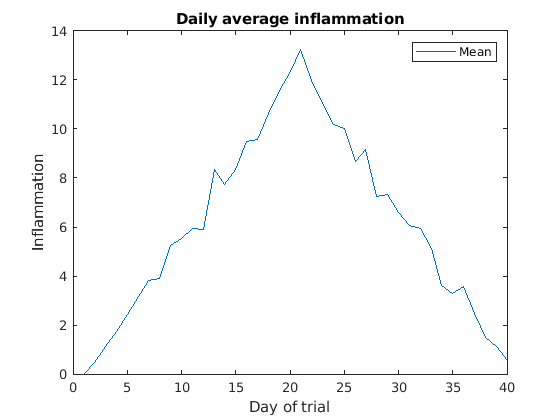
Image 1 of 1: ‘Average inflamation and Patient 5’
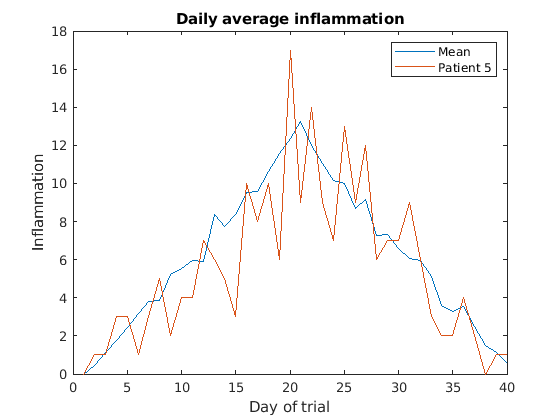
Image 1 of 1: ‘Max Min subplot’
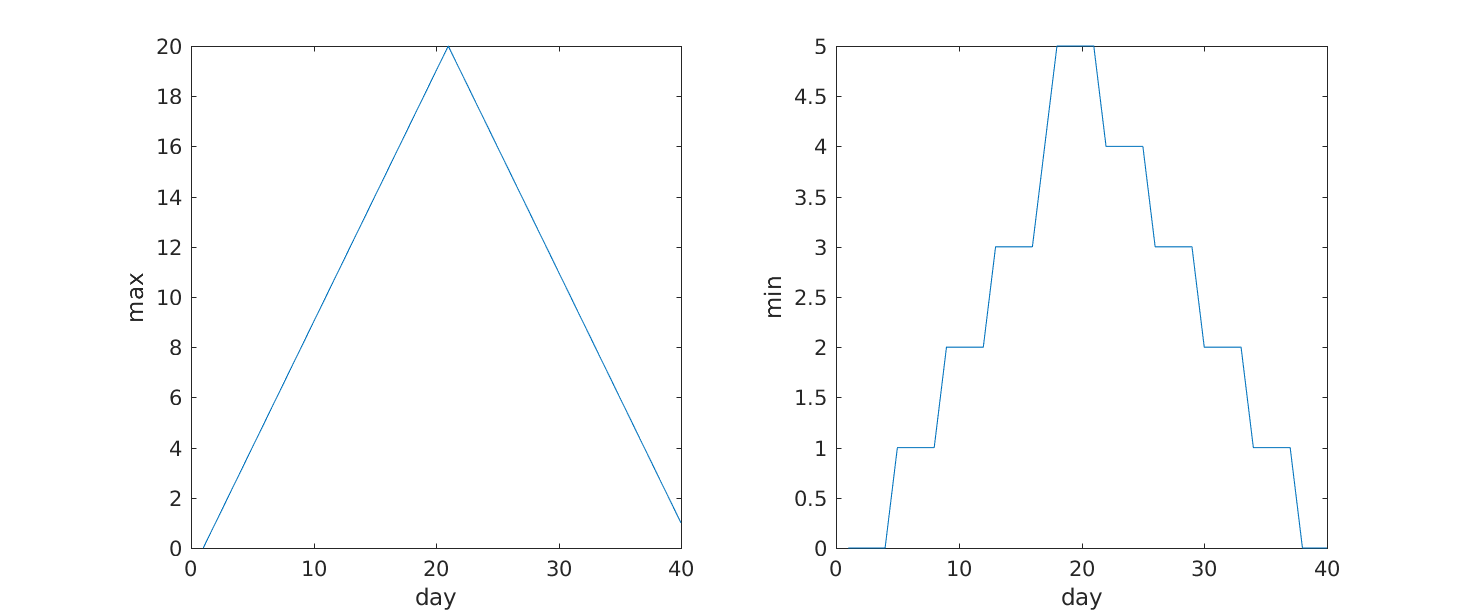
Image 1 of 1: ‘Heat map’
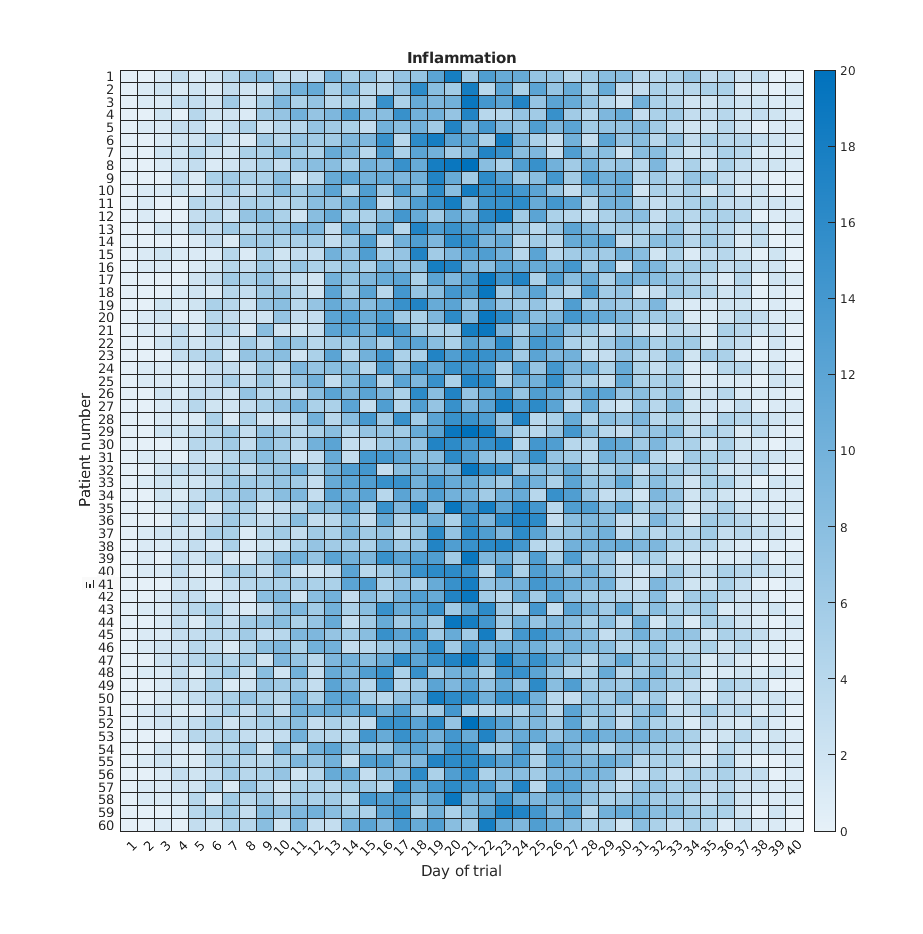
Image 1 of 1: ‘imagesc Heat map’
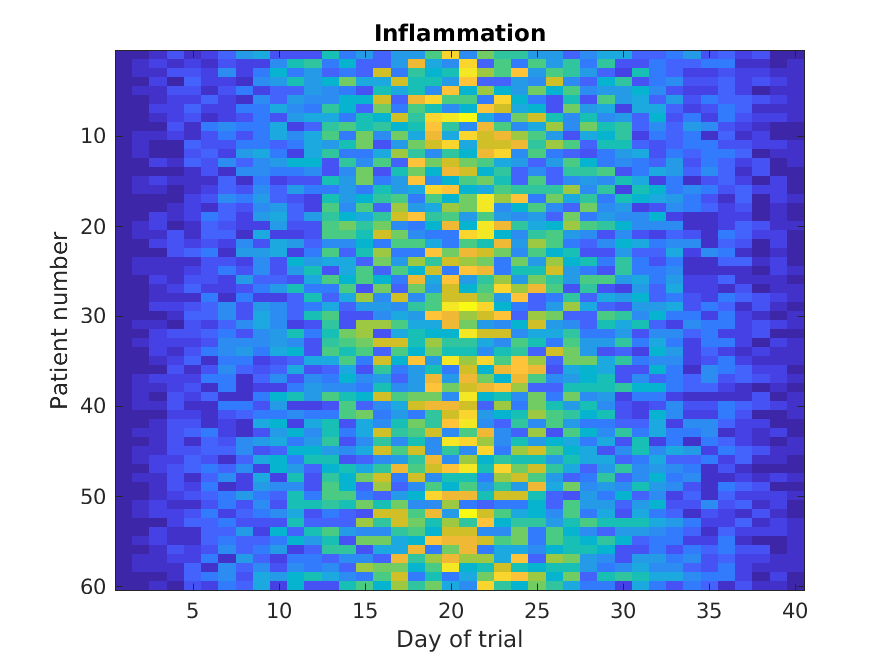
Image 1 of 1: ‘Plotting patient vs mean’
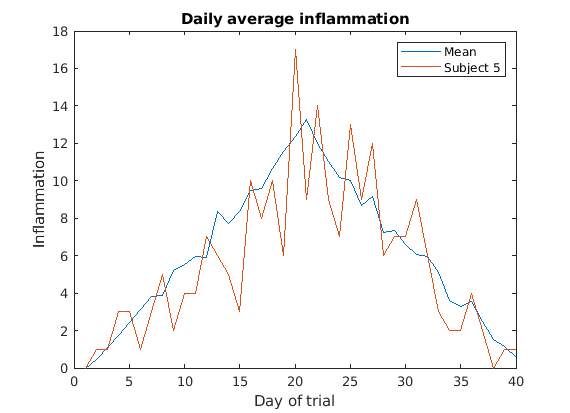
Image 1 of 1: ‘debugger-demo’
This process is illustrated below: 
Image 1 of 1: ‘inflammation-01.png’
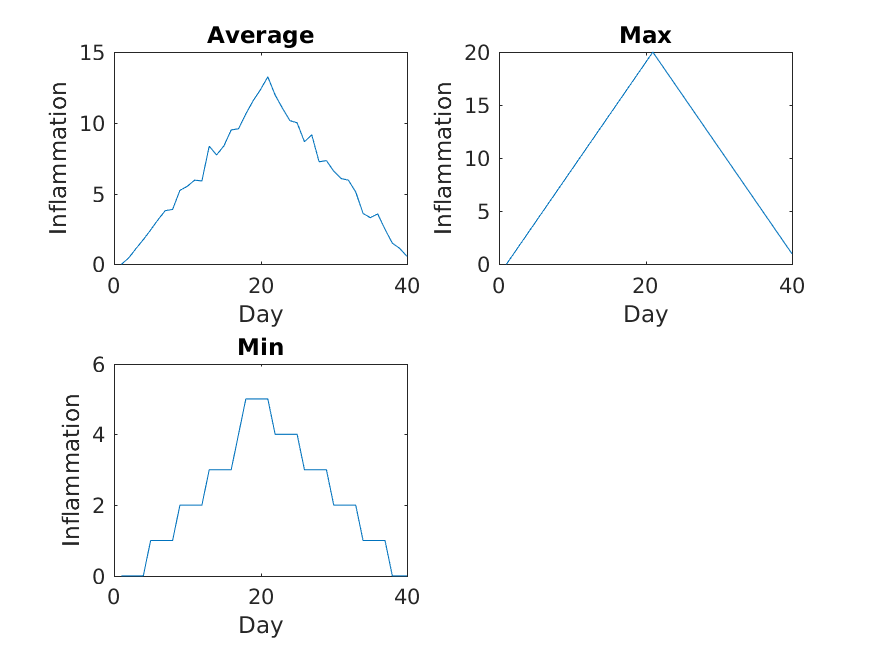
Image 1 of 1: ‘inflammation-02.png’
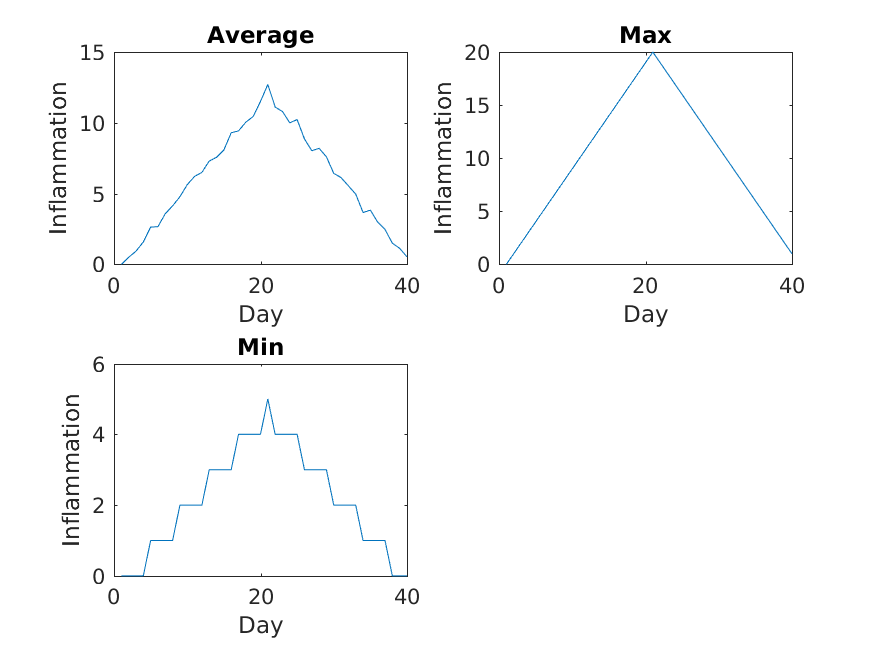
Image 1 of 1: ‘inflammation-03.png’
