All Images
Image 1 of 1: ‘Accessing a single value’

Image 1 of 1: ‘Accessing a submatrix’

Image 1 of 1: ‘Accessing strided rows and columns’

Image 1 of 1: ‘Accessing a row’

Image 1 of 1: ‘Accessing multiple rows’

Image 1 of 1: ‘Accessing multiple columns’

Image 1 of 1: ‘Accessing strided columns’

Image 1 of 1: ‘Information saved in each data file.’
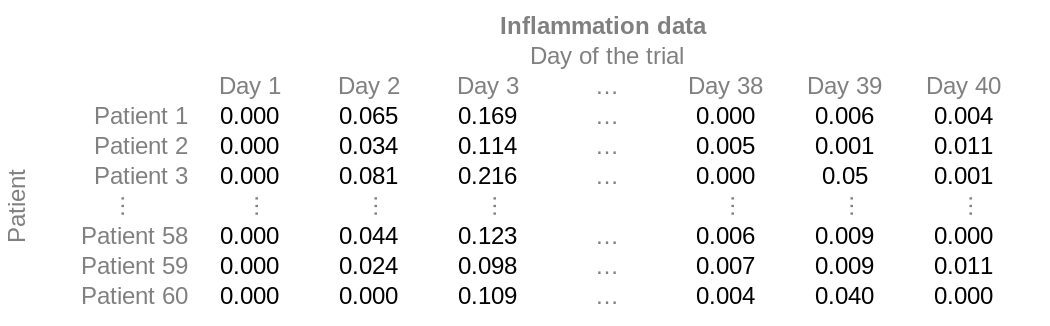
Image 1 of 1: ‘Average inflammation’

Image 1 of 1: ‘Max inflammation with no labels’

Image 1 of 1: ‘Maximum inflammation’

Image 1 of 1: ‘Average inflammation with legend’

Image 1 of 1: ‘Average inflammation and Patient 5’

Image 1 of 1: ‘Average inflammation and Patients 3 & 4’

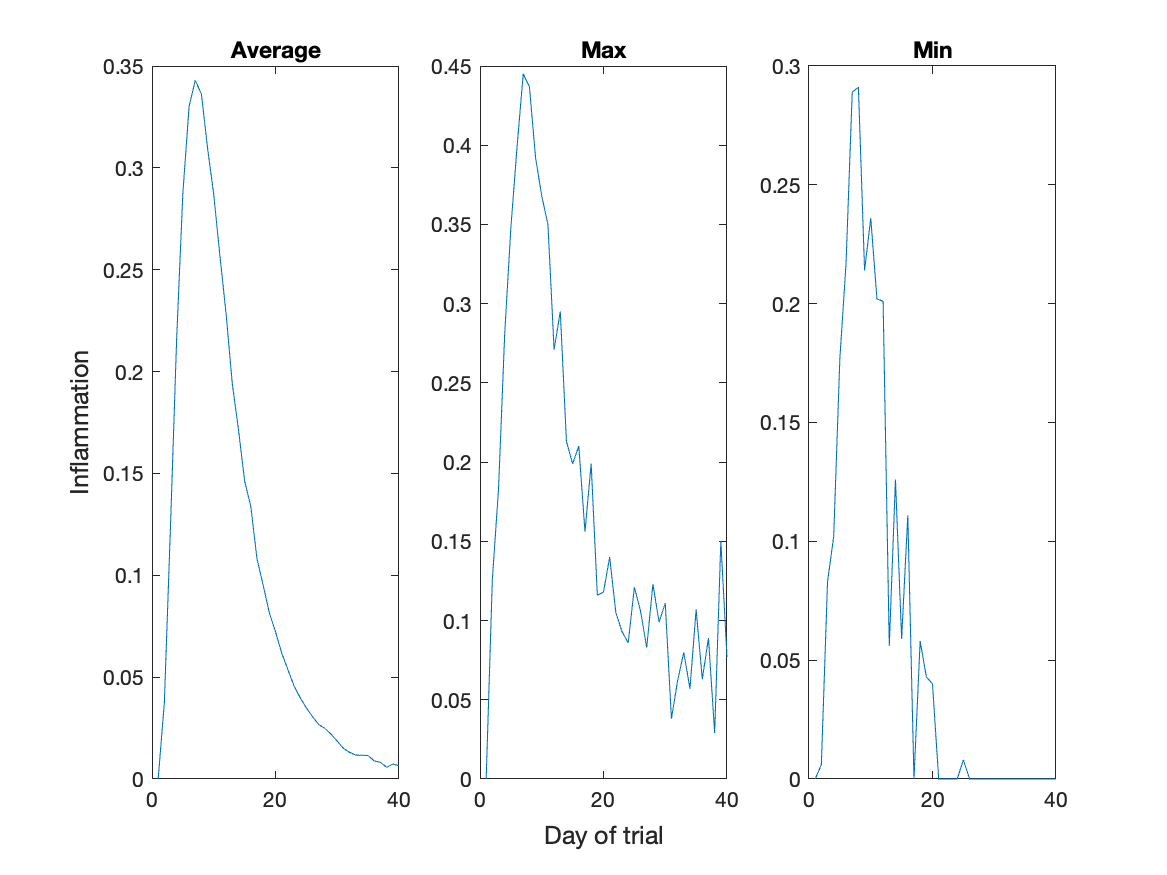
Image 1 of 1: ‘Max Min tiledplot’

Image 1 of 1: ‘Max Min tiledplot with shared labels’

Image 1 of 1: ‘Heat map’

Image 1 of 1: ‘imagesc Heat map’

Image 1 of 1: ‘Drop-down menu with the option "type code to run"’
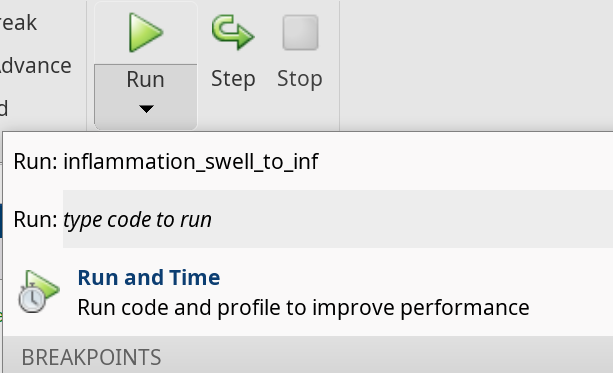
Image 1 of 1: ‘Prompt with pre-filled line of code and filled input value’
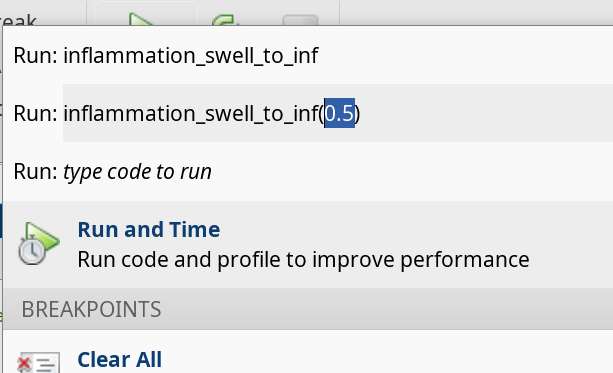
Image 1 of 1: ‘Drop-down menu with the options to run the code with the previously specified input values’
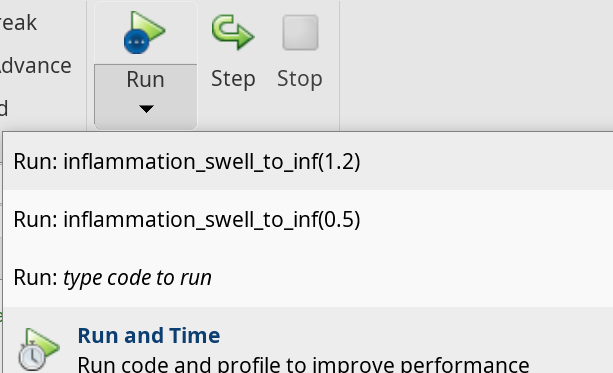
Image 1 of 1: ‘debugger-demo’
This process is illustrated below: 
Image 1 of 1: ‘inflammation-01.png’
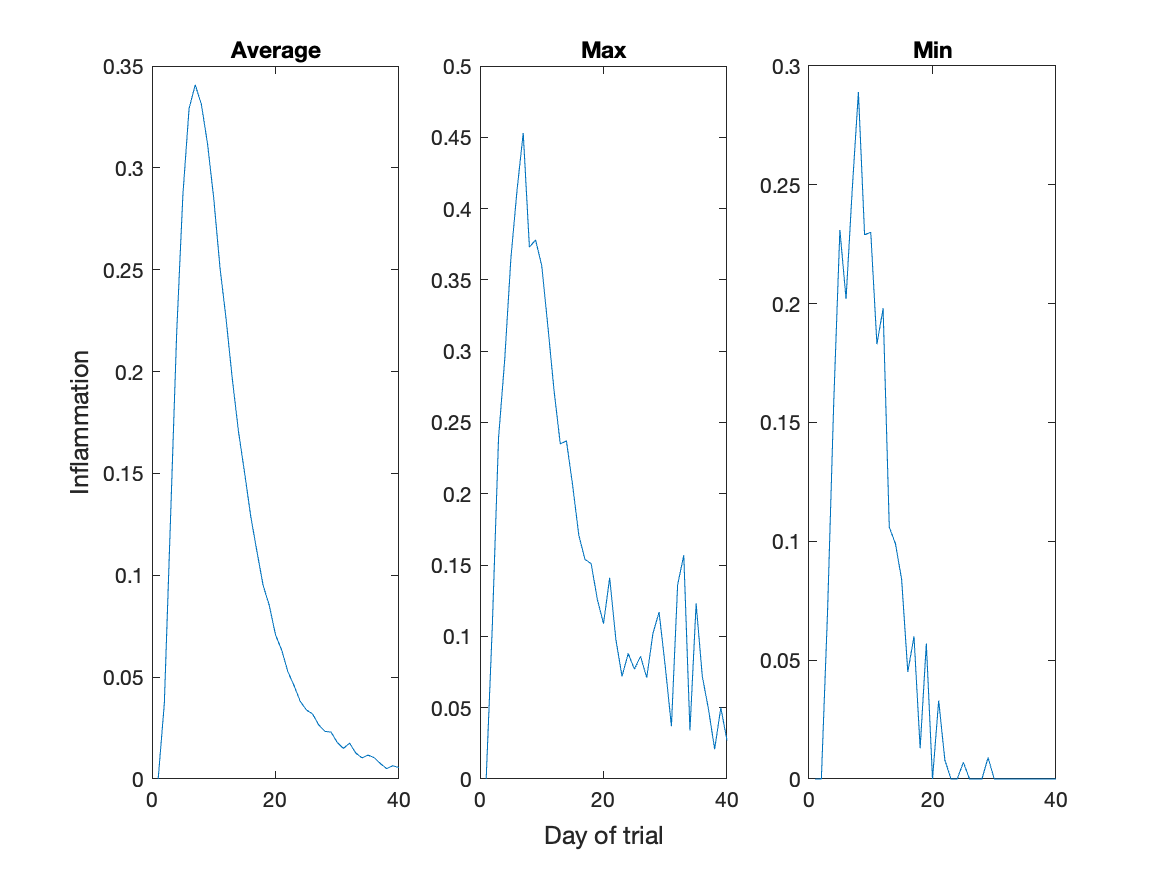
Image 1 of 1: ‘inflammation-02.png’
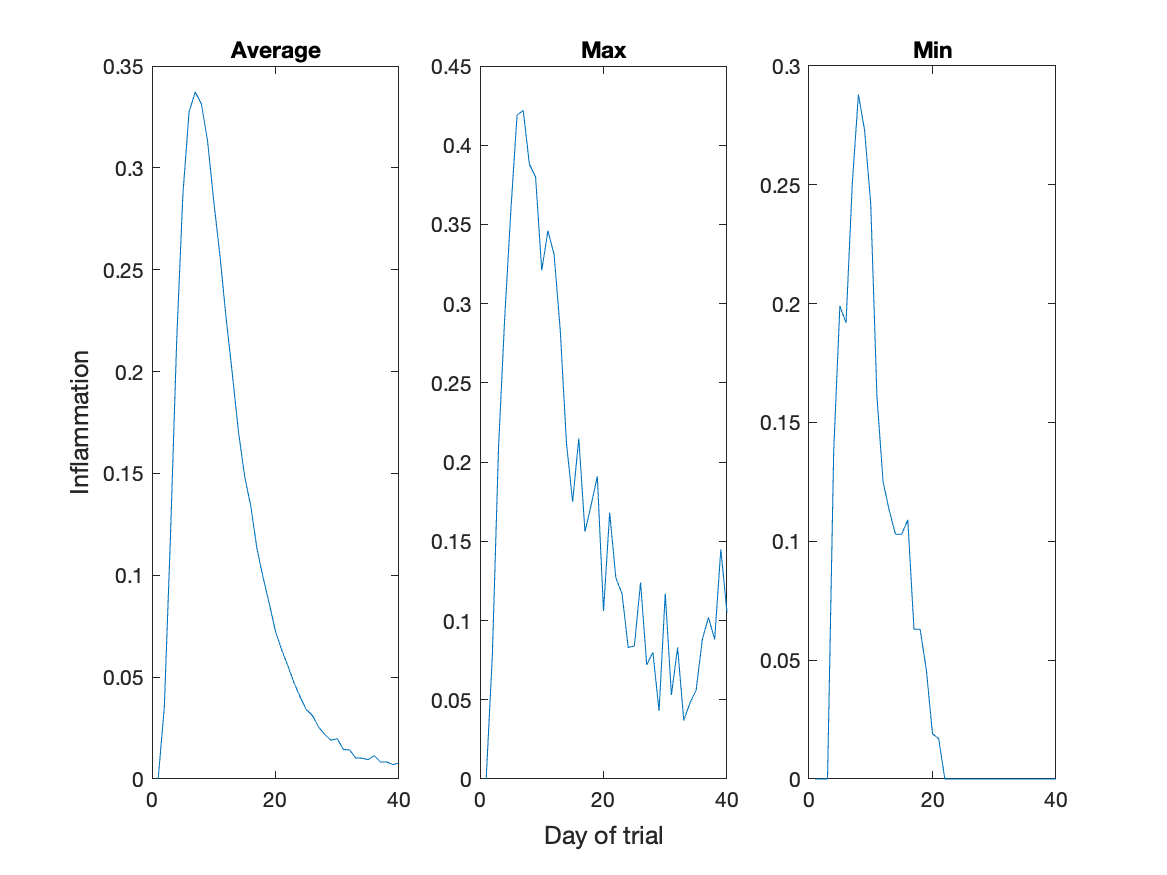
Image 1 of 1: ‘inflammation-03.png’